Points Layer
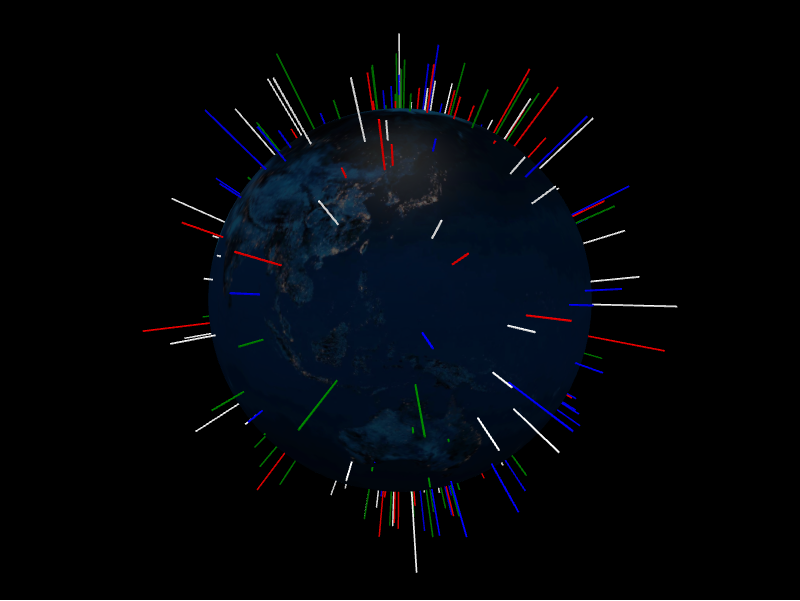
The points layer renders one marker per PointDatum, positioned by latitude and
longitude and optionally extruded above the surface.
from IPython.display import display

from pyglobegl import (
    GlobeConfig,
    GlobeLayerConfig,
    GlobeWidget,
    PointDatum,
    PointsLayerConfig,
)

points = [
    PointDatum(lat=0, lng=0, altitude=0.25, color="#ff0000", label="Center"),
    PointDatum(lat=15, lng=-45, altitude=0.12, color="#00ff00", label="West"),
]

config = GlobeConfig(
    globe=GlobeLayerConfig(
        globe_image_url="https://cdn.jsdelivr.net/npm/three-globe/example/img/earth-day.jpg"
    ),
    points=PointsLayerConfig(points_data=points),
)

display(GlobeWidget(config=config))
PointDatum
Each point carries lat, lng, altitude, color, radius, and label
fields (with globe.gl defaults for anything you omit). Set altitude to raise the
marker above the surface, and label for the hover tooltip.
Custom tooltip
PointDatum.label is each point's hover tooltip. To compute one from the datum or
share a constant across the layer, set a layer-level point_label — a
frontend Python callback (datum → string),
a plain string (one tooltip for every point), or None (the default) to use each
datum's label. Swap it at runtime with GlobeWidget.set_point_label(...).
From a GeoDataFrame
points_from_gdf builds PointDatum lists straight from a GeoDataFrame —
see GeoPandas helpers.
To update points after the widget renders, see Runtime updates & callbacks.