Heatmaps Layer
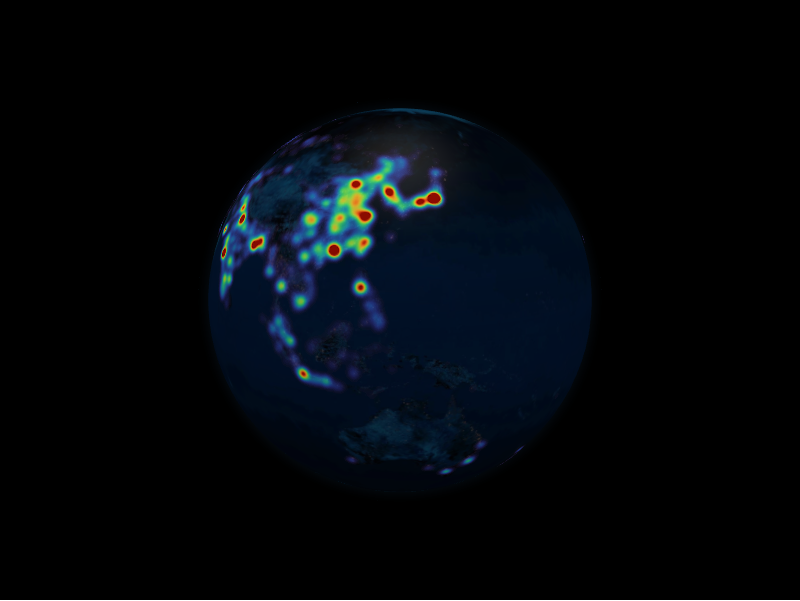
The heatmaps layer renders weighted density fields over the surface. Each
HeatmapDatum holds a collection of HeatmapPointDatum samples plus bandwidth
and colour controls.
from IPython.display import display

from pyglobegl import (
    GlobeConfig,
    GlobeWidget,
    HeatmapDatum,
    HeatmapPointDatum,
    HeatmapsLayerConfig,
)

heatmap = HeatmapDatum(
    points=[
        HeatmapPointDatum(lat=0, lng=0, weight=1.0),
        HeatmapPointDatum(lat=10, lng=10, weight=0.6),
    ],
    bandwidth=0.8,
    color_saturation=2.5,
)

config = GlobeConfig(heatmaps=HeatmapsLayerConfig(heatmaps_data=[heatmap]))

display(GlobeWidget(config=config))
HeatmapDatum and HeatmapPointDatum
HeatmapPointDatum— one sample withlat,lng, andweight.HeatmapDatum— a group of points plusbandwidth(kernel width) andcolor_saturationcontrolling how intensity maps to colour.
Custom colormap
By default the layer uses globe.gl's built-in colormap. To control it, pass a
heatmap_color_fn — a frontend Python callback
that maps a normalised density t in [0, 1] (0 is the lowest weight, 1 the
peak) to a CSS colour string. globe.gl samples it at data-change time to bake the
colour lookup, so it is not called per animation frame.
from pyglobegl import frontend_python


@frontend_python
def colormap(t):
    red = int(255 * t)
    return f"rgb({red},{int(90 * t)},{255 - red})"


config = GlobeConfig(
    heatmaps=HeatmapsLayerConfig(heatmaps_data=[heatmap], heatmap_color_fn=colormap)
)
Leave heatmap_color_fn as None (the default) to keep globe.gl's colormap. You
can also swap it at runtime with GlobeWidget.set_heatmaps_color_fn(...), and
passing None restores the default.
From a GeoDataFrame
heatmaps_from_gdf builds heatmap points from point geometries with a
weight_column. See GeoPandas helpers.